Cross-Market Signals
A factor-based map of U.S.–China market interdependence
Most studies of market integration reach for correlation coefficients. But correlation is a blunt instrument.
This thesis takes a different approach: using a universe of 153 macro-financial factors organized into 13 thematic clusters, it asks whether one country's economic signals can statistically explain another's equity market returns — and whether that relationship holds equally in both directions.
Hamzeh Hamdan — Harvard College
Advisor: Prof. Emil Siriwardane
Can one country's macro-financial signals statistically explain another's stock market returns?
International equity markets are increasingly integrated — yet the nature of that integration is neither symmetric nor static. A shock that ripples from Wall Street to Shanghai does not necessarily echo back. This thesis formalizes that intuition, measuring cross-market signal transmission as an empirical question: given a rich factor universe, how much additional explanatory power is gained by adding one country's economic factors to a model that already uses the other country's own factors? If that gain is large and asymmetric, it reveals the direction in which information actually flows.
This thesis operationalizes two distinct predictive tasks:
The Replicating Portfolio Framework
Rather than measuring correlation between two return series, this thesis uses a replicating portfolio approach to formalize market integration. The central question is rephrased as an optimization problem: what weighted combination of economic factors best tracks one market's returns? The quality of that replication, measured by R², is the integration statistic.
The Core Idea
Why Replication, Not Correlation?
Pukthuanthong and Roll (2009) argue that bivariate correlation between market returns is a poor measure of financial integration. Two markets can be highly correlated simply because they share common global risk factors — not because they are informationally linked. R² from a multi-factor regression is superior: it captures the degree to which a comprehensive factor panel simultaneously explains return variation, rather than any single pairwise relationship.
Mathematical Problem & Derivation
Let R_M denote one market's return and X ∈ ℝᴺ denote a panel of N macro-financial factors from the other market. We seek a portfolio weight vector w ∈ ℝᴺ that minimizes the mean-squared prediction error:
Expanding the squared error reveals two key quantities: Σ = Cov(X, X) (the N×N factor covariance matrix) and σ_M = Cov(X, R_M) (the factor–return covariance vector). Step through the derivation below to see how these lead to the closed-form solution.
Minimize mean-squared prediction error over the weight vector w:
Interpretation
The optimal w* gives the projection of the market return onto the factor span. Its R² — the fraction of return variance explained — is the thesis's primary measure of cross-market integration.
The ΔR² Test
This thesis extends the replication framework to the cross-country case. The factor universe is partitioned by country origin: domestic factors (own-country) vs. foreign factors (cross-country). A model is fit first using only domestic factors, yielding R²_domestic. A second model is fit using only foreign factors, then a combined model. The key statistic is ΔR² = R²_combined − R²_domestic: how much does adding foreign signals improve on what domestic signals already capture?
Why Replication? — 5 Advantages Over Bivariate Correlation
Unlike bivariate correlation, the framework harnesses all N factors simultaneously, capturing complex multivariate relationships.
R² ∈ [0, 1] has a natural interpretation as the proportion of market return variance explained by foreign factors.
ΔR² isolates the incremental explanatory power of cross-country factors above and beyond domestic ones, operationalizing directionality.
Common global shocks load onto both countries' factors. Since they're accounted for by own-country factors, ΔR² captures only country-specific spillovers.
In high-dimensional settings (N ≫ T), Σ becomes ill-conditioned. Ridge regression replaces the exact inversion with a regularized approximation: (Σ + λI)⁻¹ · σ_M.
Literature
Propose R² from a multi-factor regression as a superior measure of global market integration. Show that correlation between market returns is misleading when common factors dominate.
Find China largely segmented from global financial markets during 1993–2006, with integration accelerating after WTO accession in 2001.
Document strong U.S.–China financial links emerging after 2001. Cross-market factor exposure grows substantially post-WTO, particularly in high-frequency data.
Introduce the Global Factor Dataset (JKP) — a standardized, comparable panel of 153 equity market factors across 13 themes for 93 countries. The thesis uses this as its primary predictor universe.
A Large Panel of Macro-Financial Signals
The analysis draws on the Jensen, Kelly, and Pedersen (JKP) Global Factors Dataset — a comprehensive collection of 153 equity market factors organized into 13 thematic clusters, covering the U.S. and Chinese economies. Market returns are measured using the Wilshire 5000 Total Market Index (U.S.) and the Shanghai SE Composite (China). The joint analysis spans 2001–2024, beginning when China joined the WTO and became a more open, internationally integrated market.
Coverage note: Factor availability varies substantially across time. Earlier periods (pre-2005) have higher missingness, particularly for China-specific factors. The effective joint sample is constrained by the shorter Chinese factor history. See figures 06–09 for full missingness analysis.
Figures — click any to expand
The 13 Thematic Clusters
Cell size reflects factor count · click for definition
From Raw Factors to a Model-Ready Panel
Raw factor data does not arrive analysis-ready. Before any model is fit, the data must be cleaned, inspected for outliers, tested for stationarity, and transformed to satisfy the assumptions of the regression framework. This section documents the full pipeline applied to the 153 JKP factors and two market return series.
Steps — click to expand
Three Lenses, 192 Models
Rather than committing to a single model class, this thesis applies three methodologically distinct approaches — from structured linear regularization to fully nonparametric kernel smoothing. Each lens illuminates a different aspect of the factor-return relationship, and comparing their performance is itself informative.
In total, 192 models were estimated across all combinations of method, predictor granularity, time window, target market, and predictor origin. If the asymmetry is real, it should appear across the grid.
Ridge dominated the regularized sweep
Ridge dominated Lasso and Elastic Net in 45 of 48 regularized contests (measured by out-of-sample R²). This makes intuitive sense: when many factors carry small, distributed signals (rather than a sparse set of large effects), L2 regularization (Ridge) outperforms the sparsity-inducing L1 penalty (Lasso). The factor universe is dense, not sparse.
Model Specification Grid — 6 Dimensions
Each row defines one axis along which models were varied. Every combination of these choices was estimated, producing 144+ distinct specifications. The count (×n) shows how many options exist along that axis.
Cross-Validation Strategy
All linear models used sklearn's TimeSeriesSplit with 5 folds for hyperparameter tuning — preserving temporal order and preventing future data from leaking into training. SpAM models used pyGAM's built-in CV. Kernel bandwidth was selected via 5-fold CV on a 25% random subsample (due to computational cost).
Residual Plot Diagnostics — 5 Observed Patterns
Each Method in Detail
Regularized Linear Regression
The baseline lens. Ridge, Lasso, and Elastic Net regression impose penalties on coefficient magnitudes, automatically selecting and shrinking predictors in high-dimensional settings. Of 144 regularized models fit, Ridge was the best by R² in 45 of 48 cases — consistent with a dense rather than sparse factor signal. Results are split by market, factor origin (U.S. only, China only, or both), granularity (daily / monthly), and time window (2001–2024 / 2016–2024).
Which factors are linearly informative, and by how much. The regularization path shows how predictors enter the model as the penalty relaxes. Residual analysis revealed five distinct patterns (Cases 1–5) including heteroscedasticity, clipping artifacts, and trending residuals — motivating the nonlinear extensions.
48 OLS + 144 regularized = 192 total linear specifications
An Asymmetric Picture
The results tell a consistent story across all three model classes: information flows more readily from U.S. macro-financial conditions into Chinese equity markets than in the reverse direction.
R² at a Glance — Primary Results
R² at a Glance — Linear Regression
U.S.→China: Daily factors, 2016–2024 · China→U.S.: Daily factors, 2001–2024, Ridge
All Model Results — Complete R² Comparison
| Method | Freq. | Window | Target | Own R² | Cross R² | Both R² | ΔR² | Source |
|---|---|---|---|---|---|---|---|---|
| OLS | Daily | 2016–2024 | China returns | 59.5% | 19.1% | 67.3% | +7.8% | Table 4.1.1 |
| Ridge | Daily | 2001–2024 | U.S. returns | 74.4% | 2.7% | 75.1% | 0.7% | Table 4.1.2 |
| Ridge | Daily | 2001–2024 | China returns | 55.5% | 11.0% | 57.6% | +2.2% | Table 4.1.3 |
| SpAM (pyGAM) | Monthly | 2001–2024 | U.S. returns | 63.6% | 6.3% | 65.4% | 1.8% | Table 4.2.1 |
| SpAM (pyGAM) | Monthly | 2001–2024 | China returns | 45.6% | 11.7% | 49.7% | +4.0% | Table 4.2.2 |
| Kernel (NW) | Daily | 2001–2024 | China returns | — | 11.2% | — | — | Table 4.3.1 |
| Kernel (NW) | Daily | 2001–2024 | U.S. returns | — | 0.0% | — | — | Table 4.3.1 — cross-country only |
Cross-Direction Comparison — ΔR² by Model Class
| Model | U.S. → China ΔR² | China → U.S. ΔR² | Ratio |
|---|---|---|---|
| OLSdaily · 2016–2024 | +7.8 pp | — | — |
| Ridgedaily · 2001–2024 | +2.2 pp | +0.7 pp | 3.1× |
| SpAMmonthly · 2001–2024 | +4.0 pp | +1.8 pp | 2.2× |
| Kernelcross-country only | R² 0.112 | R² ≈ 0 | ∞ |
Ratio = (U.S.→China ΔR²) ÷ (China→U.S. ΔR²). OLS was estimated for Chinese returns only (shorter window). Kernel row shows cross-country-only R², not ΔR².
Strong Signal
U.S. macro-financial factors add 7.8 percentage points of R² to Chinese equity return models — a consistent, robust gain across all three model classes.
+7.8 pp
OLS
daily · 2016–2024
R² 0.595 → 0.673
+2.2 pp
Ridge
daily · 2001–2024
R² 0.555 → 0.576
+4.0 pp
SpAM
monthly · 2001–2024
R² 0.456 → 0.497
R² 0.112
Kernel
U.S.-factors-only
No Chinese data needed
U.S. macro-financial factors provide a consistent, statistically robust signal for Chinese equity returns across all three model classes. The strongest gain appeared in the OLS specification: adding U.S. factors raised R² by 7.8 percentage points (from 0.595 to 0.673) in daily data from 2016–2024. Ridge and SpAM confirmed this at +2.2 pp and +4.0 pp respectively, and the kernel model — using U.S. themes alone with no Chinese information — still achieved R² = 0.112. The consistency across model class, frequency, and time window rules out any single specification driving the result.
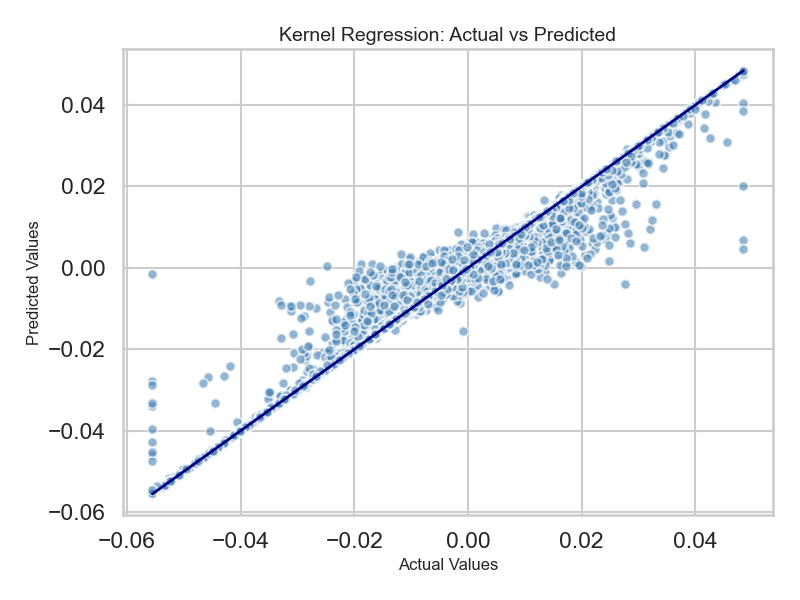
Figure 4.3.1: Kernel Regression — China Returns, Chinese Themes Only
Kernel regression predicting Chinese returns using only Chinese themes (Adj. R² = 0.90). Tight scatter around the diagonal confirms that China's own macro-financial conditions are strong self-predictors — a necessary baseline before asking whether U.S. factors add anything.
Supporting Figures
Supporting Tables
Weak Signal
Chinese macro-financial factors add less than 1 percentage point of R² to U.S. equity return models — effectively no cross-market contribution.
+0.7 pp
Ridge
daily · 2001–2024
R² 0.744 → 0.751
+1.8 pp
SpAM
monthly · 2001–2024
R² 0.636 → 0.654
R² ≈ 0
Kernel
Chinese-factors-only
Predicts mean every period
Chinese macro-financial factors add essentially no explanatory power to U.S. equity return models, regardless of model class or time window. Ridge showed a gain of only +0.7 pp when Chinese factors were added to a U.S.-only baseline of R² = 0.744, and SpAM added +1.8 pp — both negligible. The kernel model provided the starkest evidence: using only Chinese themes to predict U.S. returns yielded R² ≈ 4.6×10⁻¹⁵, effectively predicting the historical mean every period with no variation captured whatsoever. This near-zero, consistent result across all specifications is the thesis's central asymmetric finding.
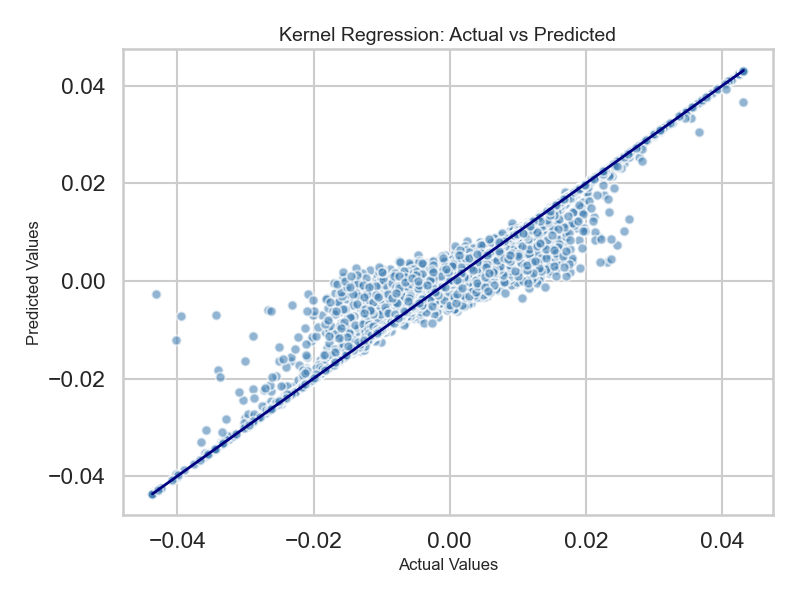
Figure B.0.18: Kernel Regression — U.S. Returns, U.S. Themes Only
Kernel regression on U.S. returns using only U.S. themes (Adj. R² = 0.88). The tight scatter confirms that U.S. macro-financial conditions strongly predict U.S. equity returns — a robust domestic baseline.
Supporting Figures
Supporting Tables
Nonlinear Relationships — Partial Dependence Analysis
Partial dependence plots (PDPs) show how the model's predicted return changes as a single factor varies across its empirical range, with all other factors held at their mean. In both SpAM and Kernel regression, PDPs reveal economically interpretable nonlinear relationships that linear models cannot capture.
SpAM Partial Dependence — Key Relationships
What the Data Is Saying
Interdependence is directional.
U.S. macro-financial conditions carry a statistically detectable signal for Chinese equity returns — adding roughly 7.8 percentage points of R² in linear models. The reverse is not true: Chinese factors contribute less than 1 pp to U.S. return prediction. This asymmetry likely reflects the dominant role of U.S. markets in setting global risk pricing. When American macro conditions shift, Chinese investors respond. The reverse propagation is constrained by capital controls, information barriers, and China's partially segmented financial system.
Domestic factors dominate, but cross-market signals are real.
For both markets, own-country factors are the strongest predictors — explaining 0.55–0.60 of variance in Chinese returns and 0.70–0.80 in U.S. returns (linear models). But the cross-country contribution is asymmetric: U.S. factors add a consistent, meaningful increment to Chinese return prediction. This implies that macro-financial conditions are not locally contained, and that cross-market factor exposure is a real source of variance in international equity returns.
Flexibility and interpretability trade off sharply.
SpAM and kernel regression models achieved higher in-sample R² values but were significantly more prone to overfitting — particularly at monthly frequency where the number of observations is limited relative to parameters. The most memorable example: the 2016–2024 monthly SpAM returned R² = 0.9999, which is clearly a severe overfit. Nonlinear models provided meaningful partial dependence insights but required careful diagnostic scrutiny to distinguish genuine signals from noise.
Key Takeaways
- 01Adding U.S. factors to Chinese factor models raises R² by ~7.8 pp (linear, daily, 2016–2024). Adding Chinese factors to U.S. models raises R² by <1 pp.
- 02U.S. factors alone explain 11–19% of Chinese returns. Chinese factors alone explain 3–6% of U.S. returns.
- 03Domestic factors dominate: R² = 0.55–0.60 for China; R² = 0.70–0.80 for the U.S. using own-country data.
- 04The asymmetry is consistent across Ridge/Lasso, SpAM (pyGAM), and Kernel Regression (Nadaraya-Watson).
- 05Kernel regression using Chinese themes to predict U.S. returns predicted ~0 throughout — the most striking evidence of the directional gap.
- 06SpAM partial dependence reveals: Chinese Value (negative), U.S. Profit Growth (negative on China), Chinese Momentum (negative), U.S. Momentum (negative on U.S. — market-level reversal).
- 07Results should be interpreted as statistical tendencies within a predictive framework, not causal claims or stable trading signals.
Cross-market factor exposure is real but subtle. Incorporating U.S. macro signals into China equity allocation frameworks may improve risk attribution. The asymmetry implies that hedging U.S. risk via Chinese equities is less effective than the reverse — U.S. conditions ripple outward more readily than Chinese conditions do.
The detectability of cross-border spillovers — even in a partially segmented market like China's — suggests that capital account restrictions do not fully insulate domestic equity markets from foreign macro conditions. Monitoring U.S. factor dynamics may serve as a useful leading indicator for Chinese market risk.
The JKP factor-based framework offers a structured, multi-model alternative to bivariate return correlation for studying integration. Future work could extend to rolling windows, sector-level analyses, or causal identification strategies (IV, synthetic controls) to move beyond statistical association toward economic explanation.
Limitations
Empirical results are only as good as their honest accounting of what the analysis cannot establish. The following limitations are structural, not incidental.
Data Coverage Mismatch
U.S. factors have substantially longer histories than their Chinese equivalents. The effective joint sample is constrained by Chinese factor availability, limiting statistical power — particularly for earlier sub-periods. Some factors were excluded entirely due to excessive missingness in Chinese data.
Missingness and Stationarity
Factor data — particularly for China — exhibits substantial missing values in earlier years, addressed via theme-level aggregation and linear imputation. Of 262 monthly factor columns, 23 required stationarity transformations (20 via differencing, 1 via Yeo-Johnson). Two columns could not be made stationary by any method and were excluded.
Nonstationarity and Structural Breaks
CUSUM tests confirm structural instability in both return series (p < 0.0001), with detected breaks around 2001, 2007–2008, and 2011–2013 for the U.S., and 2001, 2007–2009, and 2015 for China — consistent with the financial crisis and Chinese retail bubble periods. Static models estimated over the full sample mask this instability.
Structural Stability Tests
Overfitting in Flexible Models
SpAM and kernel regression are flexible by design, which introduces severe overfitting risk at monthly frequency. The 2016–2024 monthly SpAM returned R² = 0.9999 for multiple configurations — a clear overfit artifact. Cross-validation mitigates but cannot fully resolve the bias-variance tradeoff with these sample sizes.
No Causal Identification
This is a predictive study, not a causal one. The statistical association between U.S. factors and Chinese returns does not identify the mechanism. Factor overlap, common global drivers, or selection artifacts may contribute to the observed patterns.
- 01Extension to a broader market universe (EM Asia, Europe) to test whether U.S. factor dominance is China-specific or globally general.
- 02Causal identification using instrumental variable or synthetic control approaches.
- 03Time-varying coefficient models to explicitly account for regime shifts and structural breaks.
- 04Rolling-window estimation to capture time-varying integration and reduce the influence of distant historical regimes.
- 05Sector-level analysis for more granular insights, as industry-specific spillovers may be stronger and more interpretable.
- 06Interaction modeling via tree-based methods or pairwise additive terms to capture cross-factor dynamics beyond the additive assumption.
- 07Inclusion of alternative data sources (news sentiment, satellite imagery, trade flow data).
Access the Full Work
The complete thesis, including all appendices and supplemental material.
@thesis{hamdan2025crossmarket,
  author    = {Hamdan, Hamzeh},
  title     = {Cross-Market Signals: How Economic Information Propagates
               Between U.S. and Chinese Equity Markets},
  school    = {Harvard College},
  year      = {2025},
  month     = {May},
  type      = {Senior Thesis},
  address   = {Cambridge, MA}
}